Navigating the Dashboard
Estimated Learning Time: 10 mins
Dashboard version: 6th May 2025
Available on desktop, mobile, and tablet, the Positive Carbon platform makes it easy for chefs, kitchen teams, sustainability professionals, and managers to access and act on food waste data intuitively.
Dashboard Guide & Details
🏠 Home Page
Your Home Dashboard is your launchpad. It offers a quick snapshot of your monthly performance and long-term progress, all at a glance.
Key Metrics Tracked:
- 🏆 Total Waste (kg)
- 💶 Euro Cost of Waste
- 🌍 Carbon Cost of Waste
- 📋 Number of Waste Logs
🔧 Dashboard Settings
- Switch between metrics in the top-right menu.
- If you manage multiple sites, use the dropdown to filter by location.

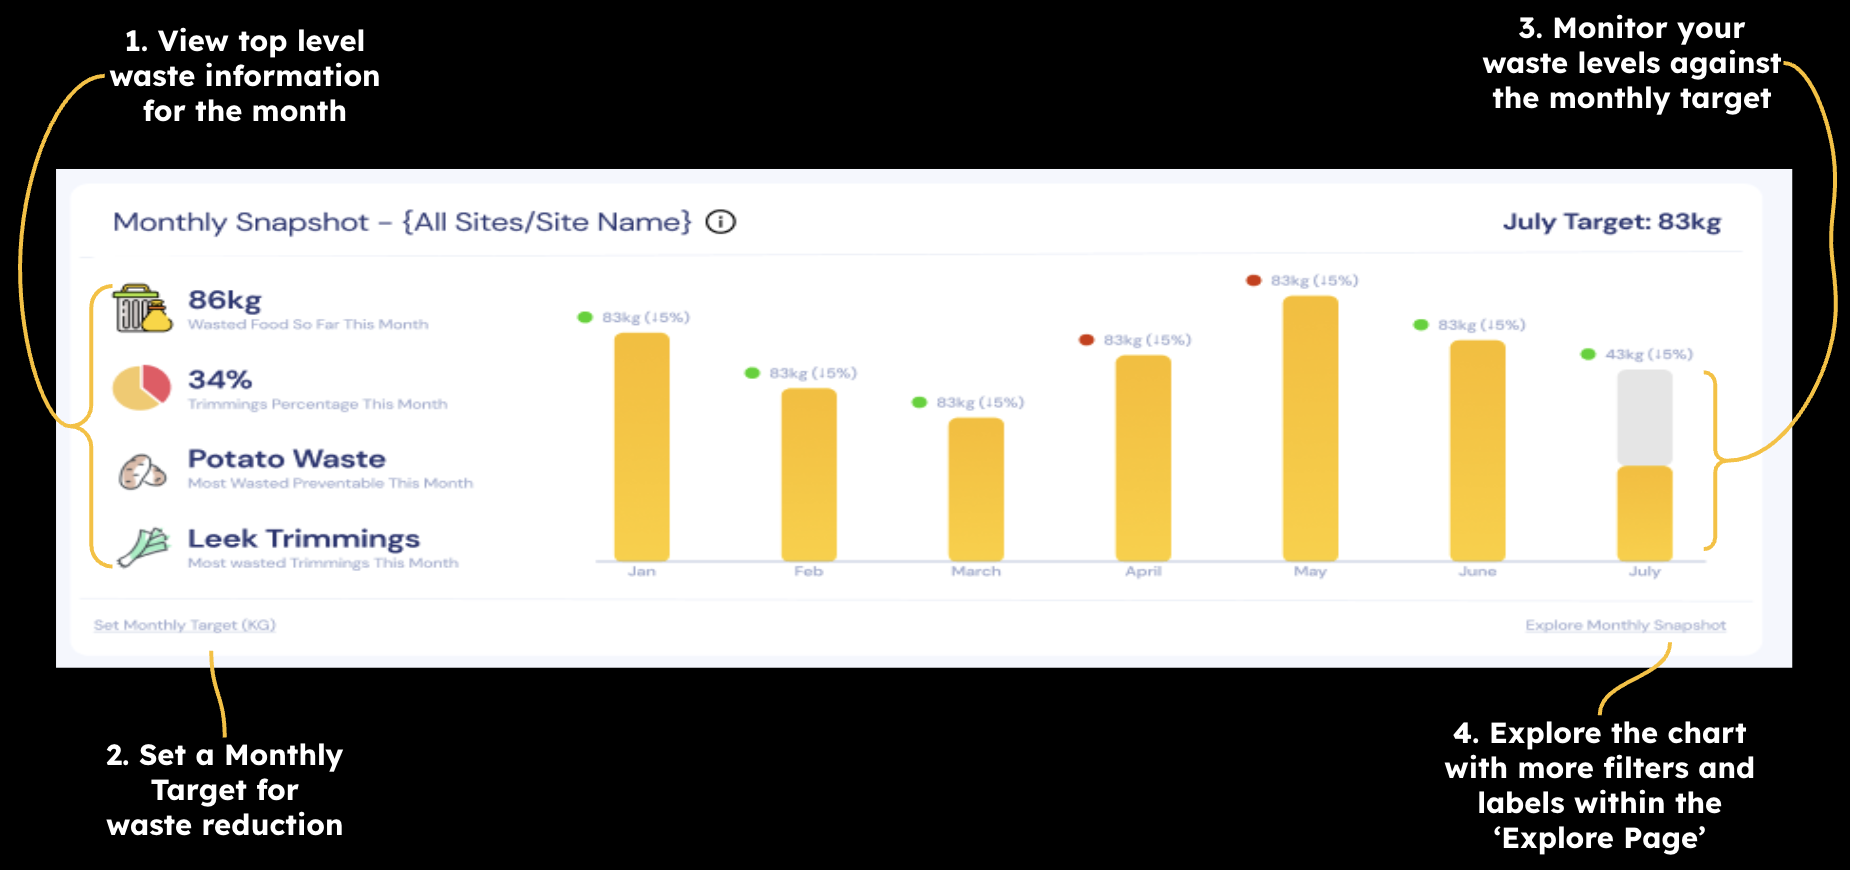
🗒️ Monthly Snapshot
See how your current month compares to the last 5 months and your target. Great for spotting improvements (or early warnings).
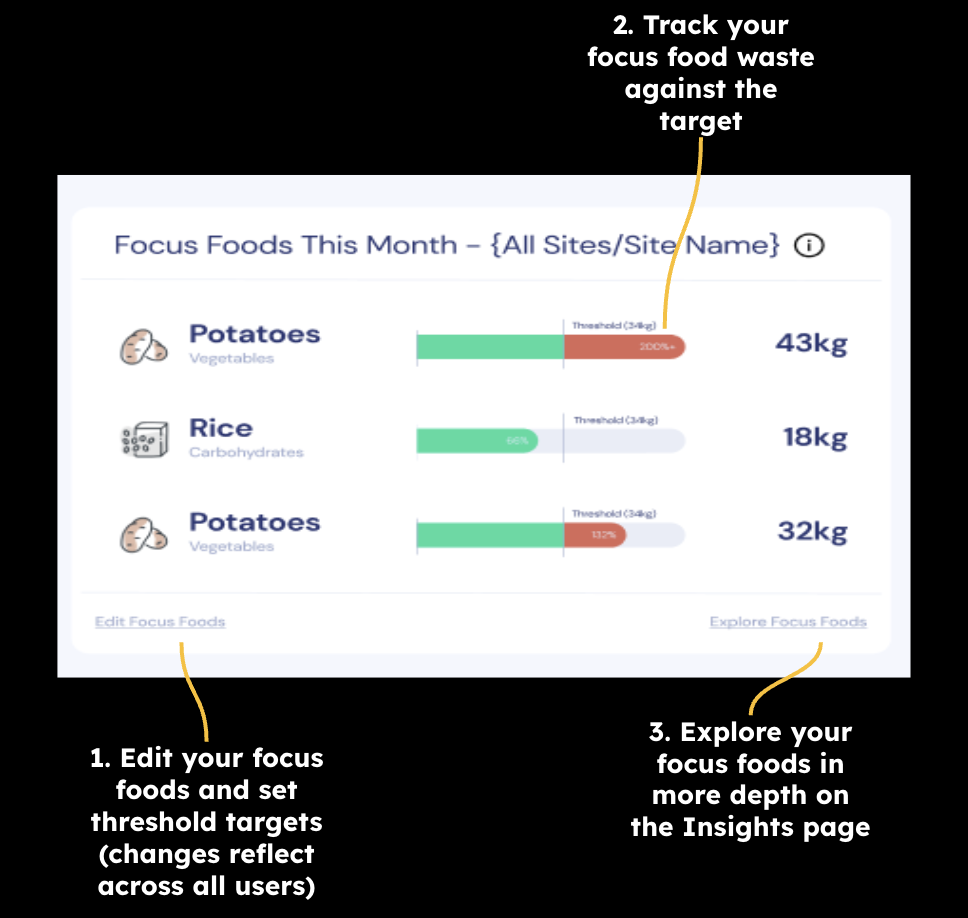
🍅 Focus Foods
Track how your designated “focus foods” are performing against their targets.
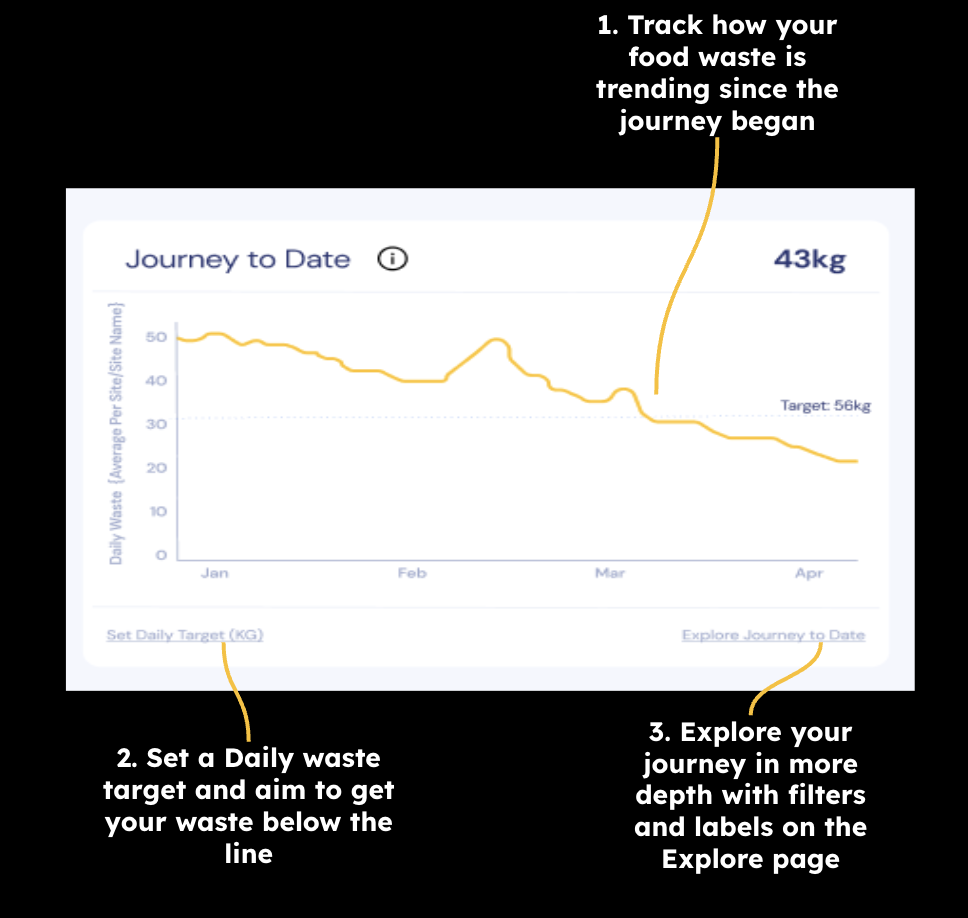
📈 Journey to Date
Monitor how your waste trends have evolved since starting your food waste journey.
Note: Graphs use a 7-day rolling average to smooth out daily fluctuations and highlight trends more clearly.
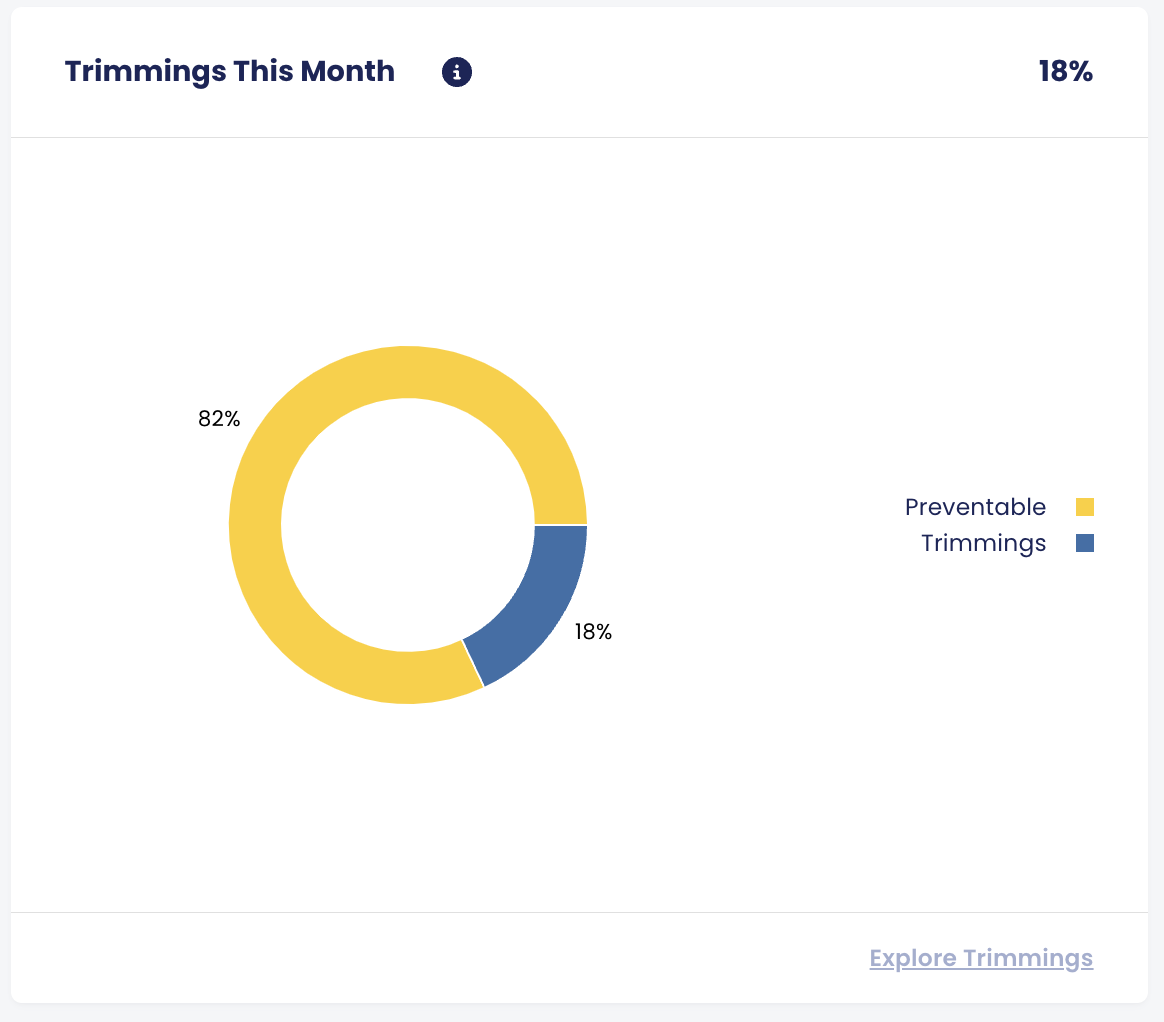
✂️ Trimmings
Get a breakdown of your waste types: Trimmings vs Preventable.
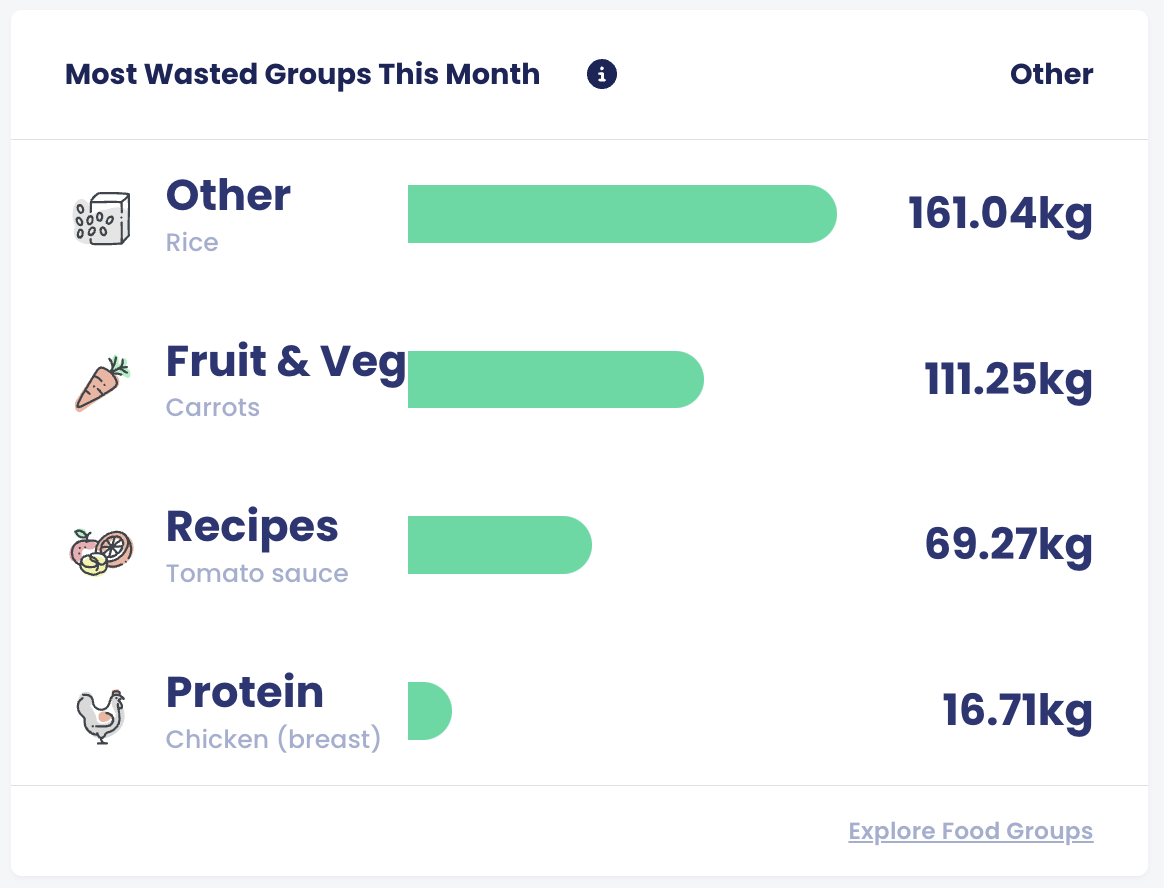
🍽️ Most Wasted Groups
Quickly see which food categories are contributing most to your waste and where to focus your efforts.
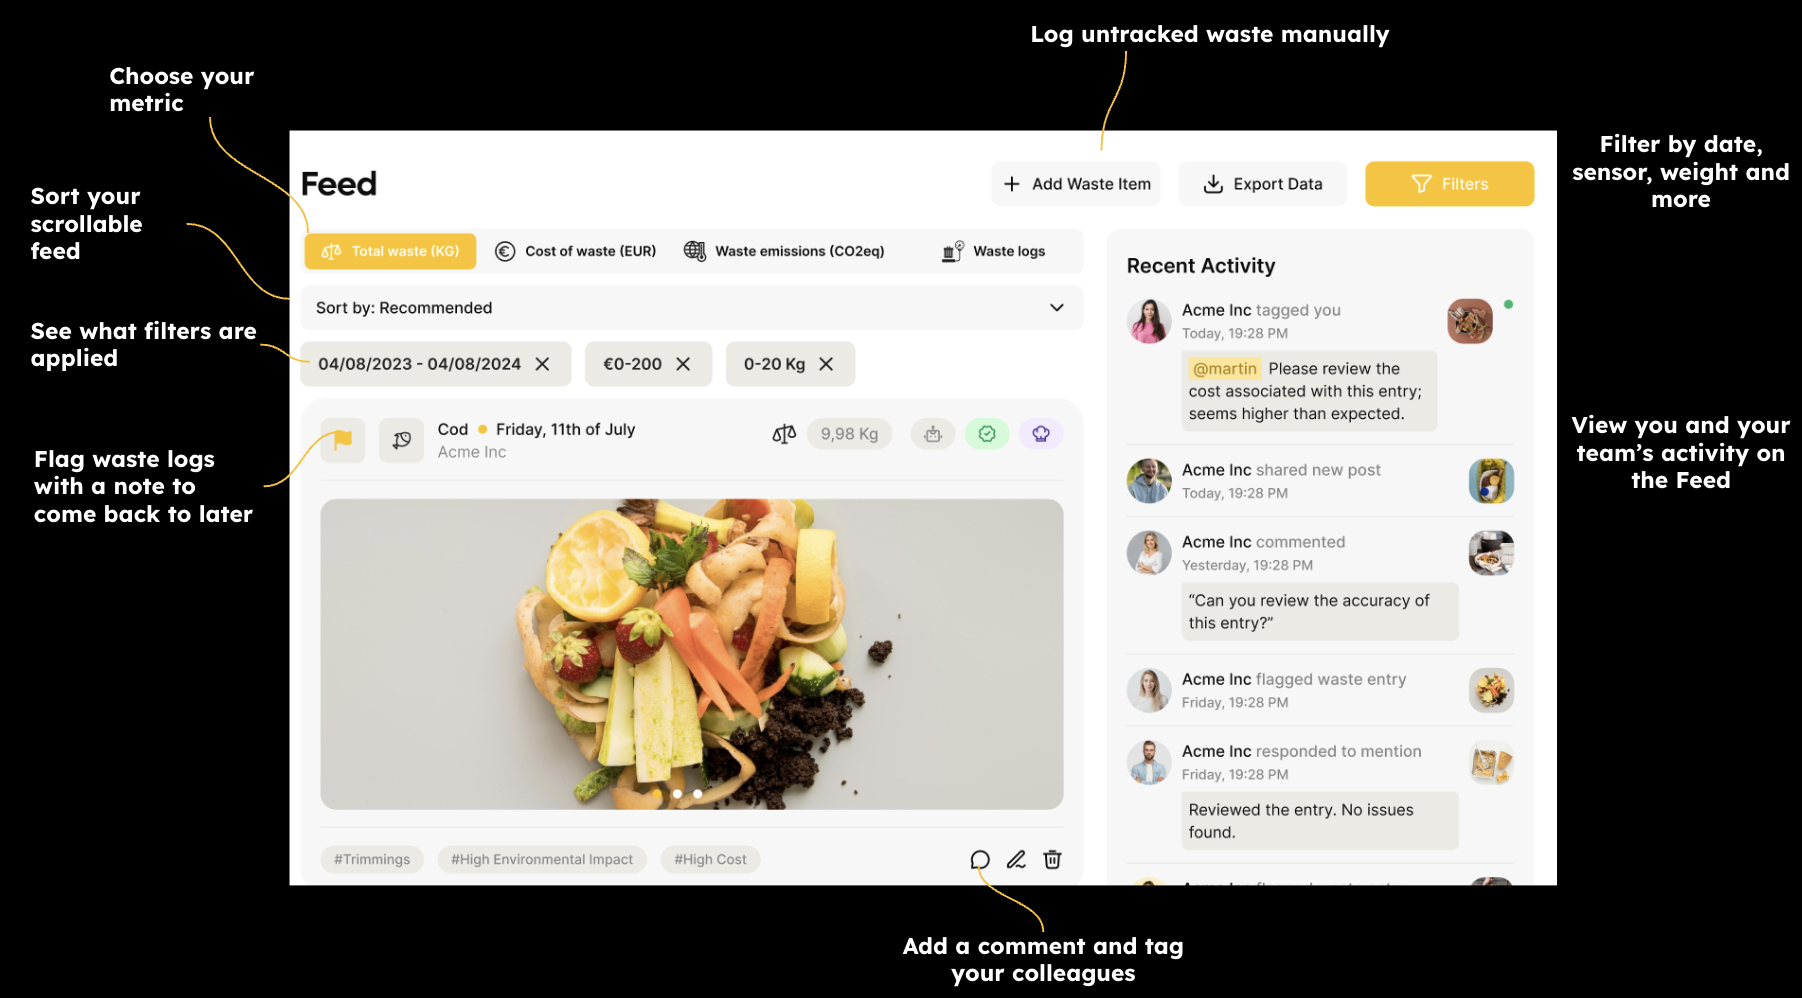
🧾 Feed
Your Feed is a scrollable list of all your food waste logs, sorted by relevance.
- Filter by date, event, or keyword
- Add comments or flags to logs for context or follow-up
📊 Insights
Explore waste patterns from multiple angles:
- Foods: Track how specific items trend over time
- Monitors: See where in the kitchen waste is happening
- Sites: Compare performance across multiple locations
Filter by date, site, sensor, food type, and more for sharper analysis.
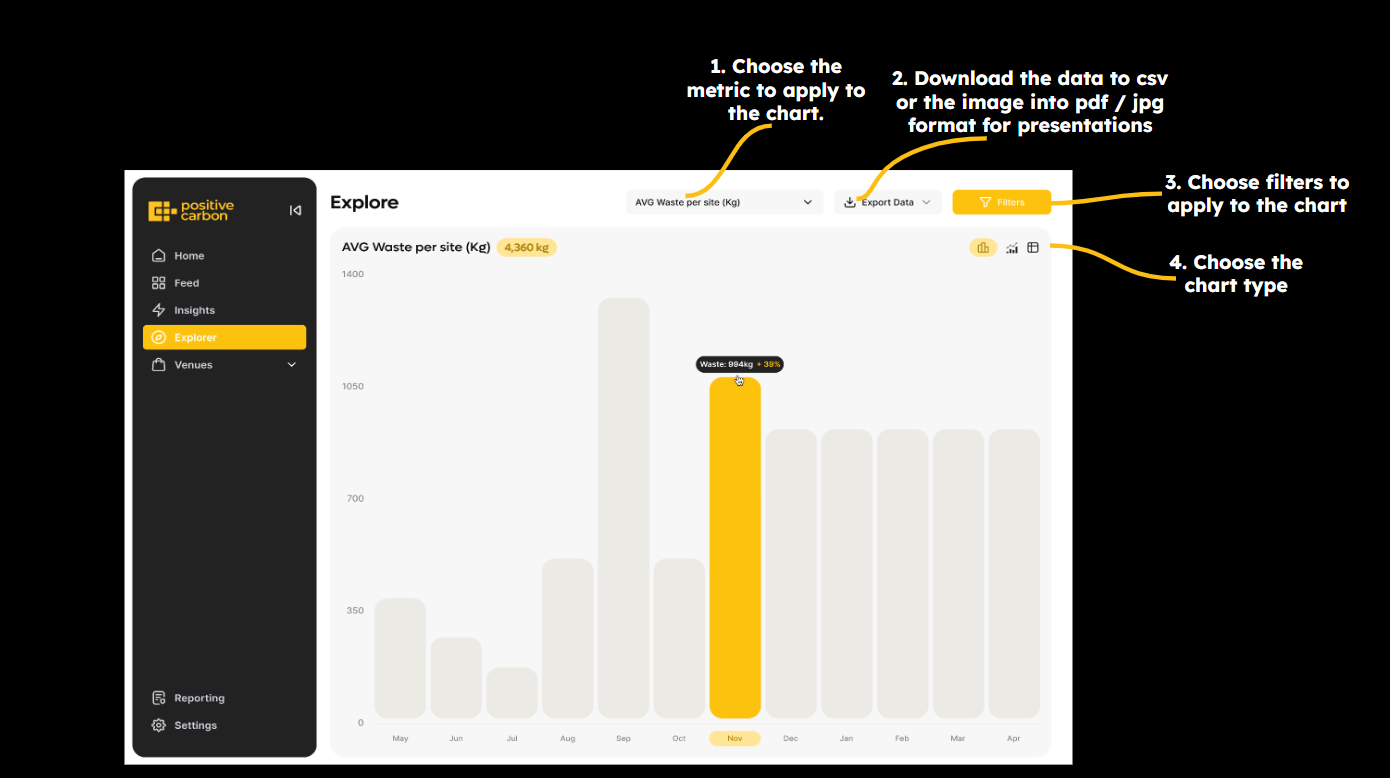
🔍 Explore
Dive deeper into your data.
- Focus on specific sites, foods, or time periods
- Analyse trends in total waste, emissions, occupancy or any other of the 9 metrics
- Choose between daily, weekly, monthly, quarterly or yearly views
- Toggle between bar charts, line graph and table view based on your preference
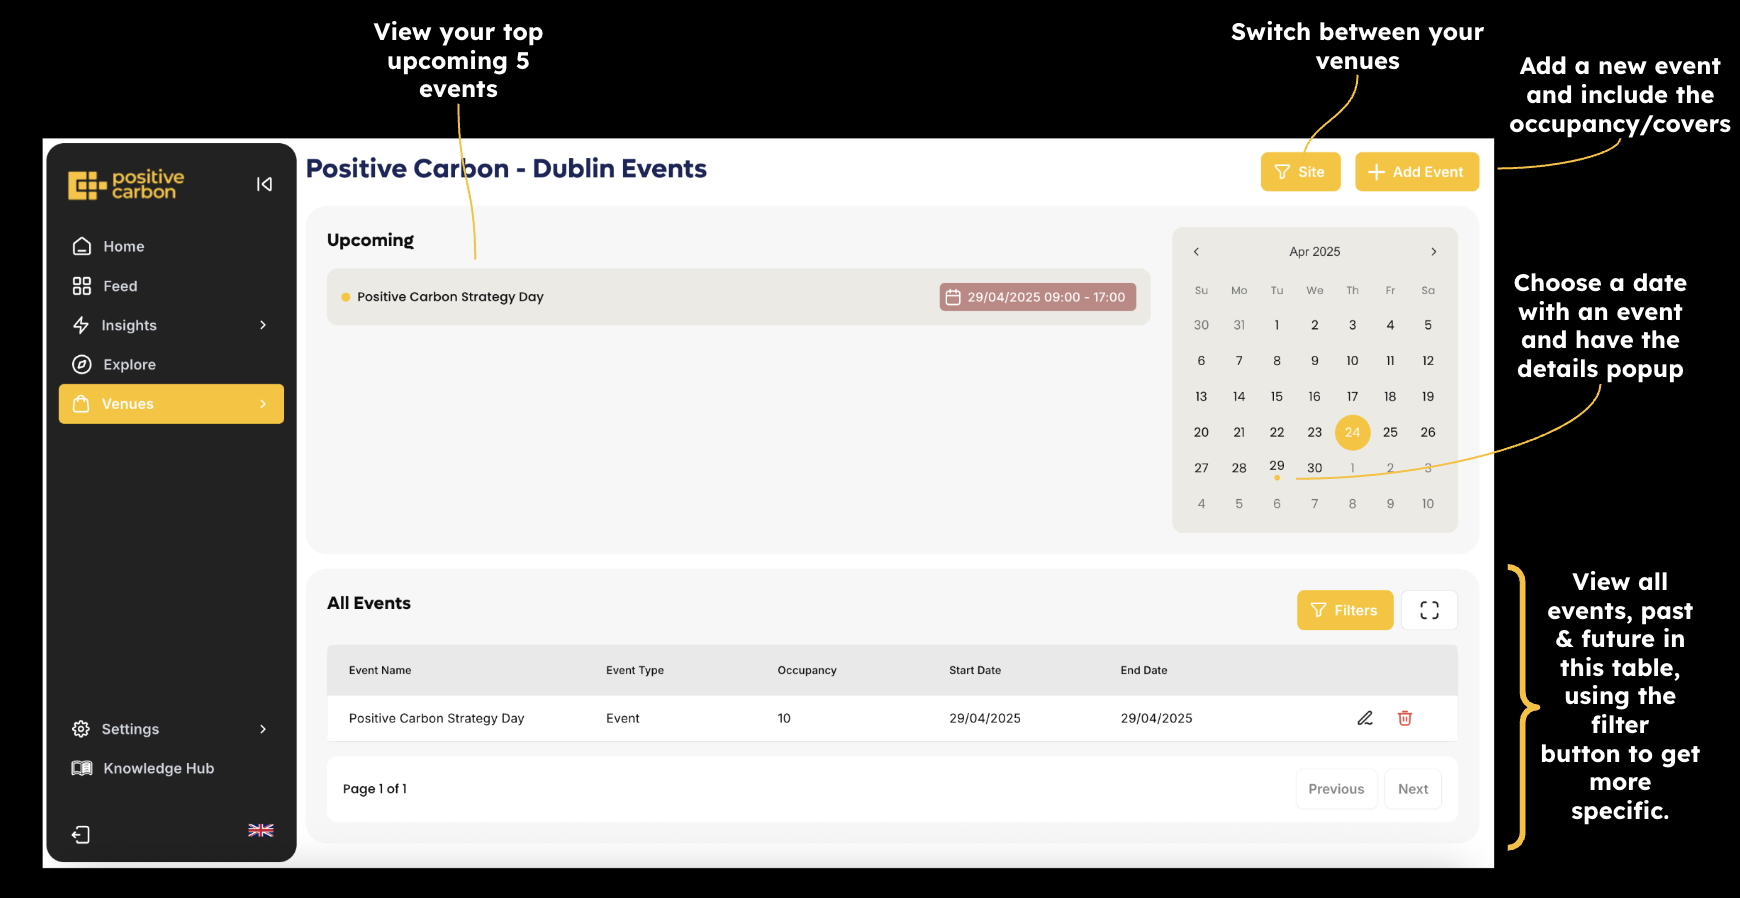
🏨 Venues
Perfect for hospitality and event-based kitchens.
Plan better, reduce waste, and analyse performance around service volumes.
You can:
- Add and manage events with details and occupancy
- Input occupancy / covers and track how occupancy affects waste
- Plan for high occupancy days and future events
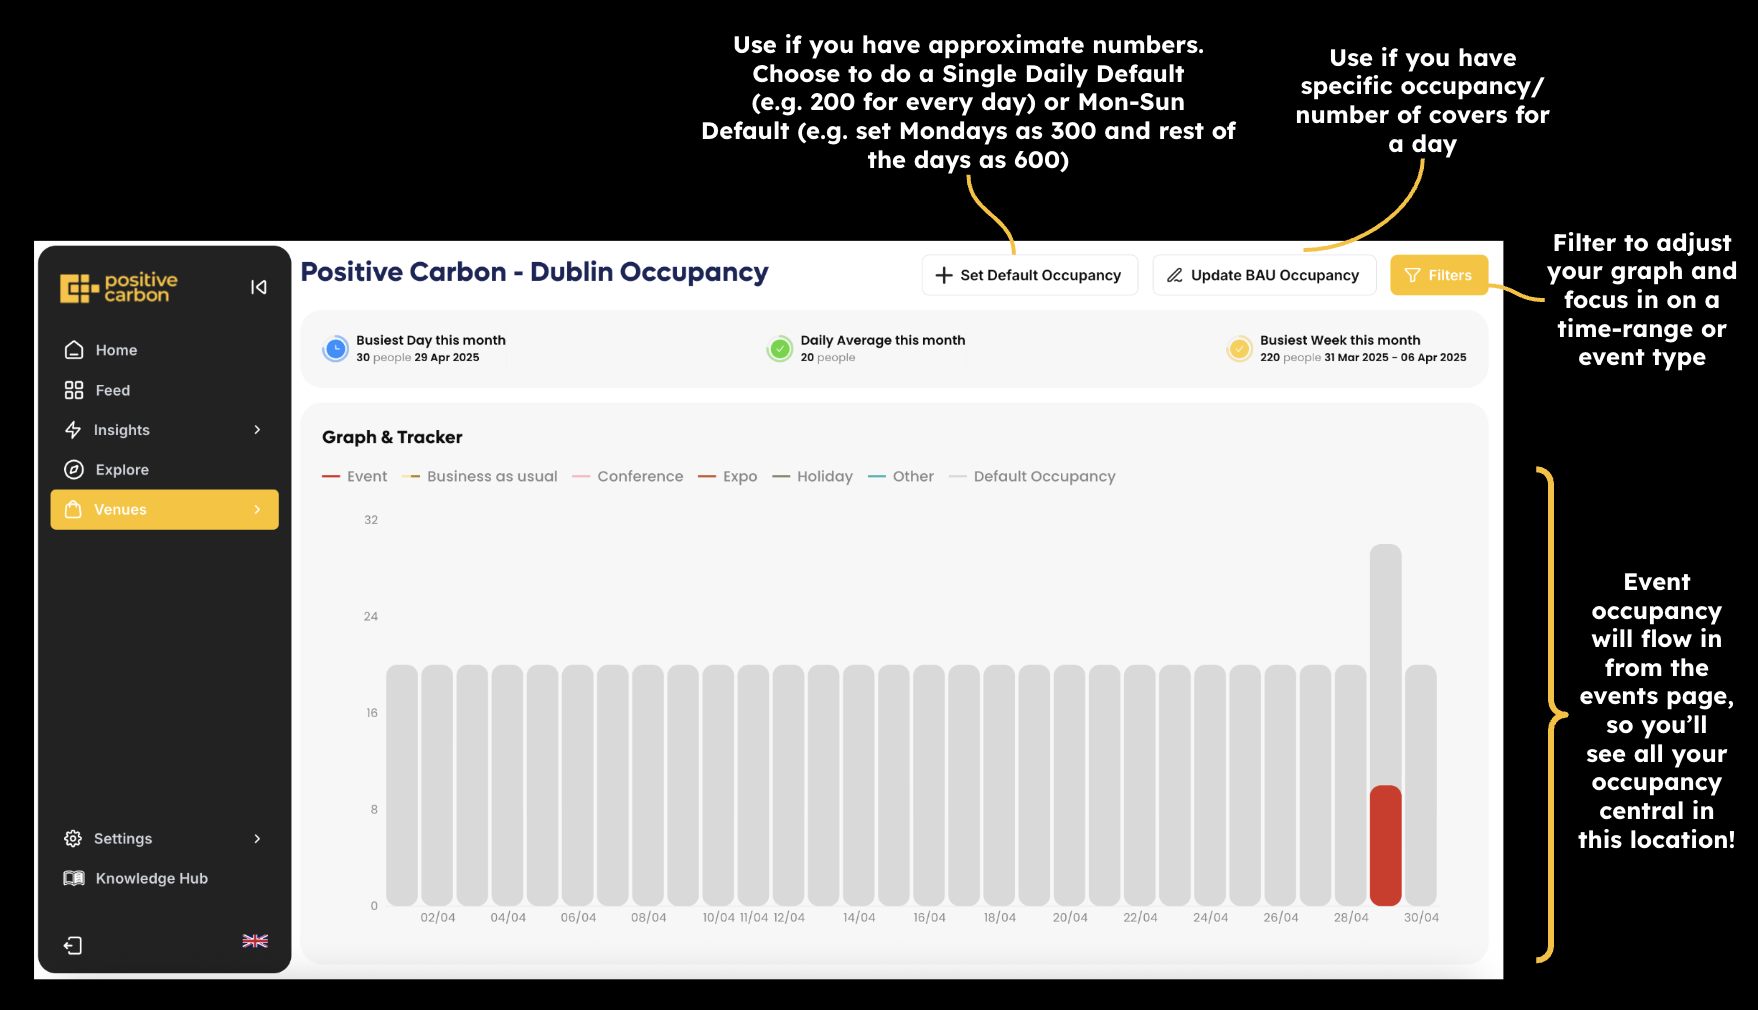
🕢 Events
👩👩👧👦 Occupancy
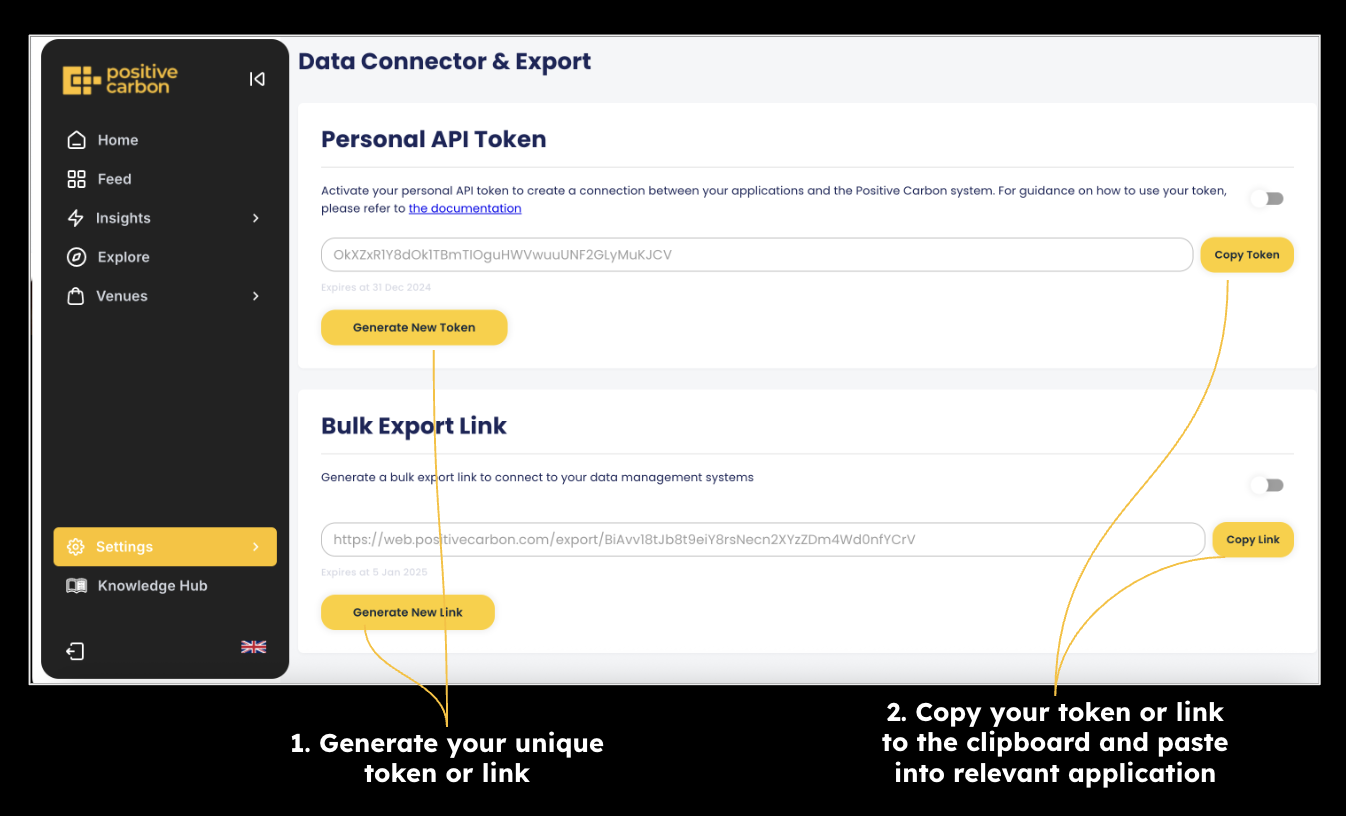
📎 Data Connector
Find this under Settings. Access your data directly via:
- API Connector – Receive real-time JSON logs. Documentation provided.
- Bulk Export – Download a full CSV of your food waste logs.